Stock Map Pro 2.0.0
Continue to app
Free Version
Publisher Description
Stock Heat Map SP500, DJ30, QQQ and US Total 6 Maps. Real time data. Sector & Industry. OHLCV, Average Volume, strength, momentum, intraday chart and fundamental data.
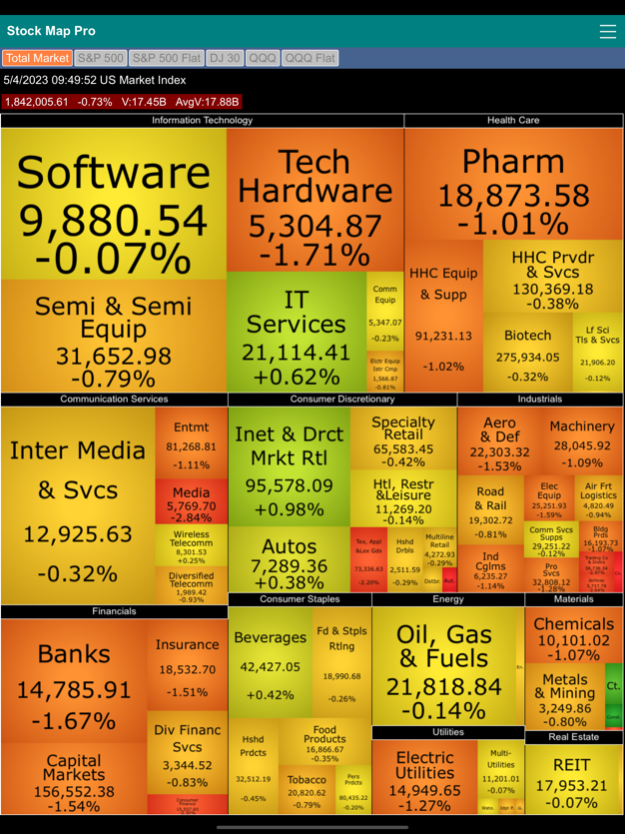
Stock market map (a.k.a. stock market heat map or stock market tree map) is a visual representation of stock market data. The size of the block in the map represents the market share of a component within its higher-level component in the hierarchy. The color of a component represents price change (gain or loss) percentage. A component on the map can be the end node (i.e., an individual stock), an industry group of multiple stocks, a market sector of multiple industries, or the entire market that the specific map is tracking.
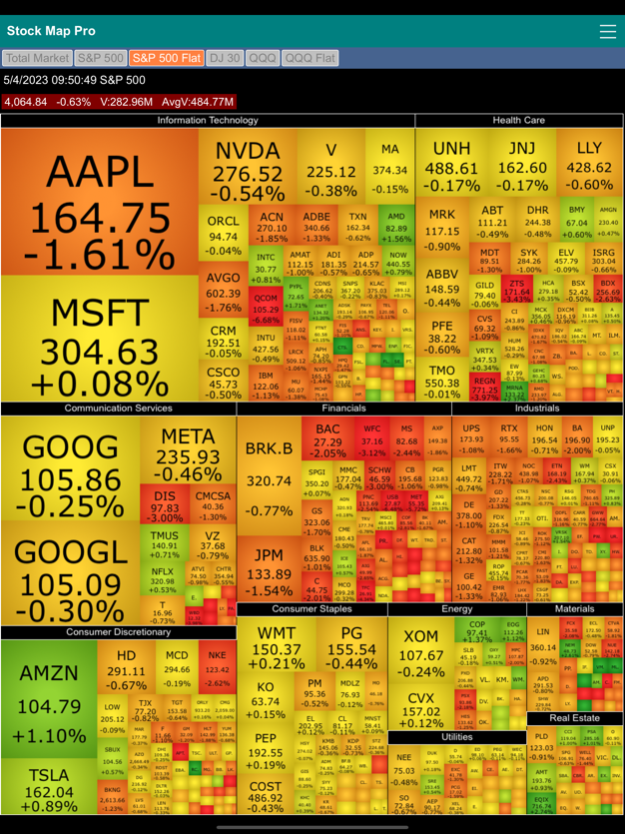
Stock Market Map Professional Edition (Stock Map Pro) contains six stock market heat maps in one app. It features the Total Market map, S&P 500 two-level map, S&P 500 flat map, Dow Jones 30 Industrial map, QQQ two-level map and QQQ flat map.
The Total Market map tracks more than 600 stocks traded on the US stock exchanges from major US companies and ADRs with the largest market capitalizations. The S&P 500 maps, DJ30 map and QQQ maps track the S&P 500 stocks, Dow Jones 30 Industrial stocks and Invesco QQQ ETF stocks respectively.
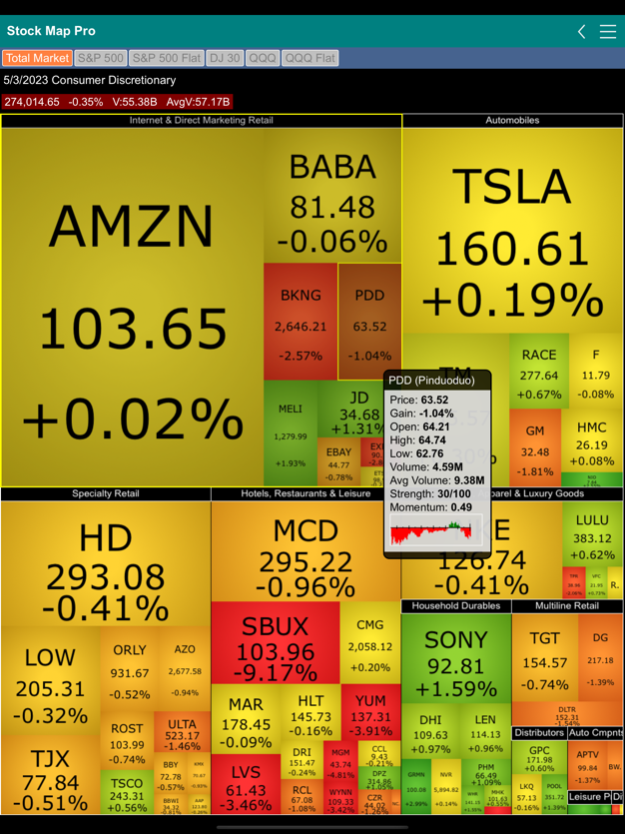
The stocks on a map are grouped in hierarchies. A market contains multiple sectors. A sector contains multiple industries. An industry contains multiple stocks. For maps with two levels, the first (root) level shows all the sectors and industries under each sector. The second level shows a specific sector and all the industries and stock under the sector. You need to navigate between the two levels to see all the stocks. For maps with one level (i.e., a “flat” map), all stocks are shown together.
The Total Market map, the S&P 500 map and the QQQ map have two levels. The first (root) level contains all the sectors and industries tracked by the markets. The second level contains a single sector and stocks under the sector. The DJ 30 map, S&P flat map and QQQ flat map have only one level.
Market data come from real-time quotes when market is open and show End-of-Date data after market close (4pm Eastern Time) and then finalized at around 8:05 pm when after hour trading ends. Data on the maps got refreshed automatically when the stock markets are opened. For each component (stock, industry index, sector index or the entire market) there is the latest price, price gain percentage, Open, high, low prices, volume, average volume and volume strength (intraday data are normalized to the portion of elapsed time within the session) and the price strength, which is the ranking of the price gain percentage of a component in comparison to all other components. There are also intraday pricing chart for every components.
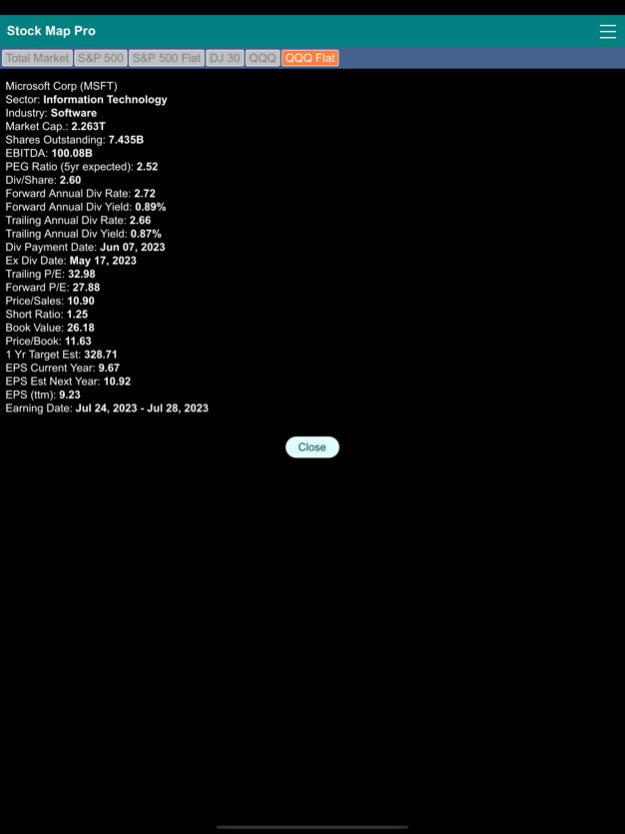
For individual stock, it also shows the fundamental data of the company, including market capitalization, outstanding shares, EBITDA, PEG Ratio, Dividend, forward and trailing dividend rate and yield, dividend payout date, ex div date, P/E, trailing and forward PE, price/sales, short ratio, book value, price/book, price target, current and forward EPS, EPS report date, … etc.
May 4, 2023
Version 2.0.0
Add two new types of maps – S&P 500 Flat Map and QQQ Flat Map. Flat maps have only one level. They do not have the “Industry” hierarchy. The stock components are shown directly (under their sectors) on the maps.
About Stock Map Pro
Stock Map Pro is a free app for iOS published in the Accounting & Finance list of apps, part of Business.
The company that develops Stock Map Pro is George Kung. The latest version released by its developer is 2.0.0.
To install Stock Map Pro on your iOS device, just click the green Continue To App button above to start the installation process. The app is listed on our website since 2023-05-04 and was downloaded 1 times. We have already checked if the download link is safe, however for your own protection we recommend that you scan the downloaded app with your antivirus. Your antivirus may detect the Stock Map Pro as malware if the download link is broken.
How to install Stock Map Pro on your iOS device:
- Click on the Continue To App button on our website. This will redirect you to the App Store.
- Once the Stock Map Pro is shown in the iTunes listing of your iOS device, you can start its download and installation. Tap on the GET button to the right of the app to start downloading it.
- If you are not logged-in the iOS appstore app, you'll be prompted for your your Apple ID and/or password.
- After Stock Map Pro is downloaded, you'll see an INSTALL button to the right. Tap on it to start the actual installation of the iOS app.
- Once installation is finished you can tap on the OPEN button to start it. Its icon will also be added to your device home screen.
